Visualizing Manuscript Metadata
Collaborators: Meghan Lyon
March 2019 to July 2019
A project to process and visualize metadata from manuscript collections being considered for a re-description project.
Responsibilities:
- Processed manuscript metadata into a simple tabular format to facilitate manual keyword select
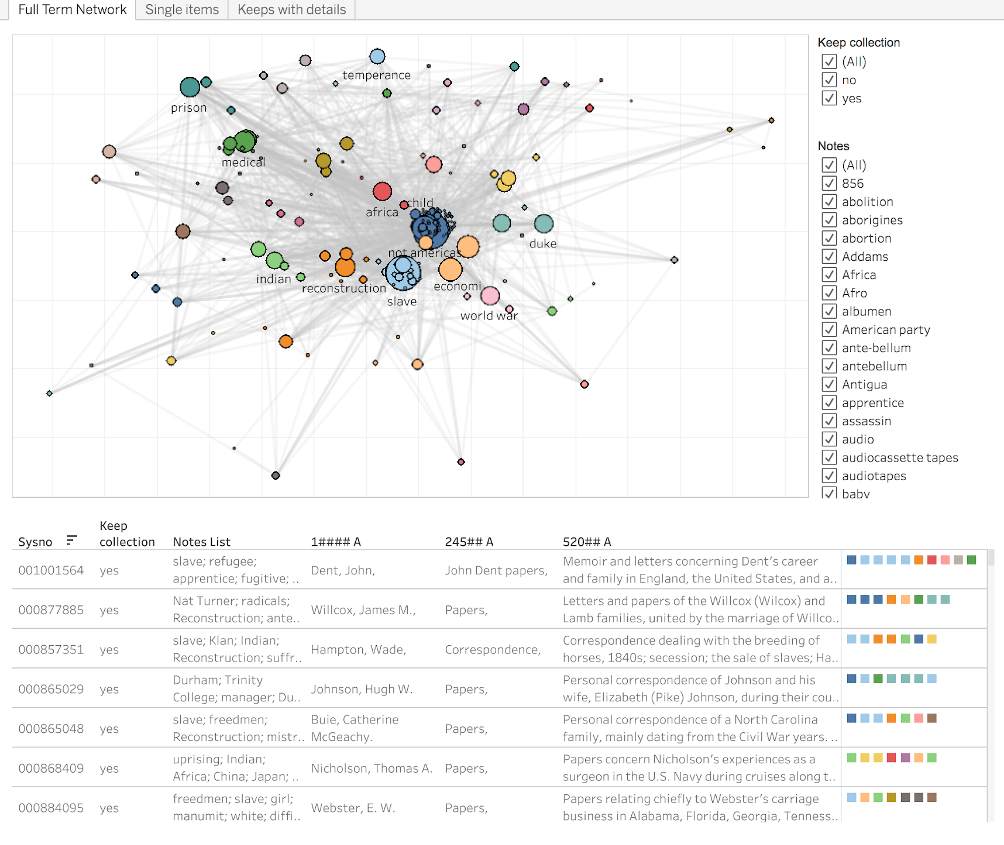
- Used manually selected keywords to further process metadata into a term co-occurrence network
- Created interactive dashboard combining tabular views of metadata with term co-occurrence network
Project Outputs:
Presentations at Conferences, Professional Gatherings
- Lyon, Meghan and Zoss, Angela M. (July 11, 2019). Exploring and Visualizing Manuscript Metadata for Project Prioritization. Presentation at 2019 TRLN Annual Meeting, Chapel Hill, NC.