Wrangling Library Reservation Data
August 2020 to August 2021
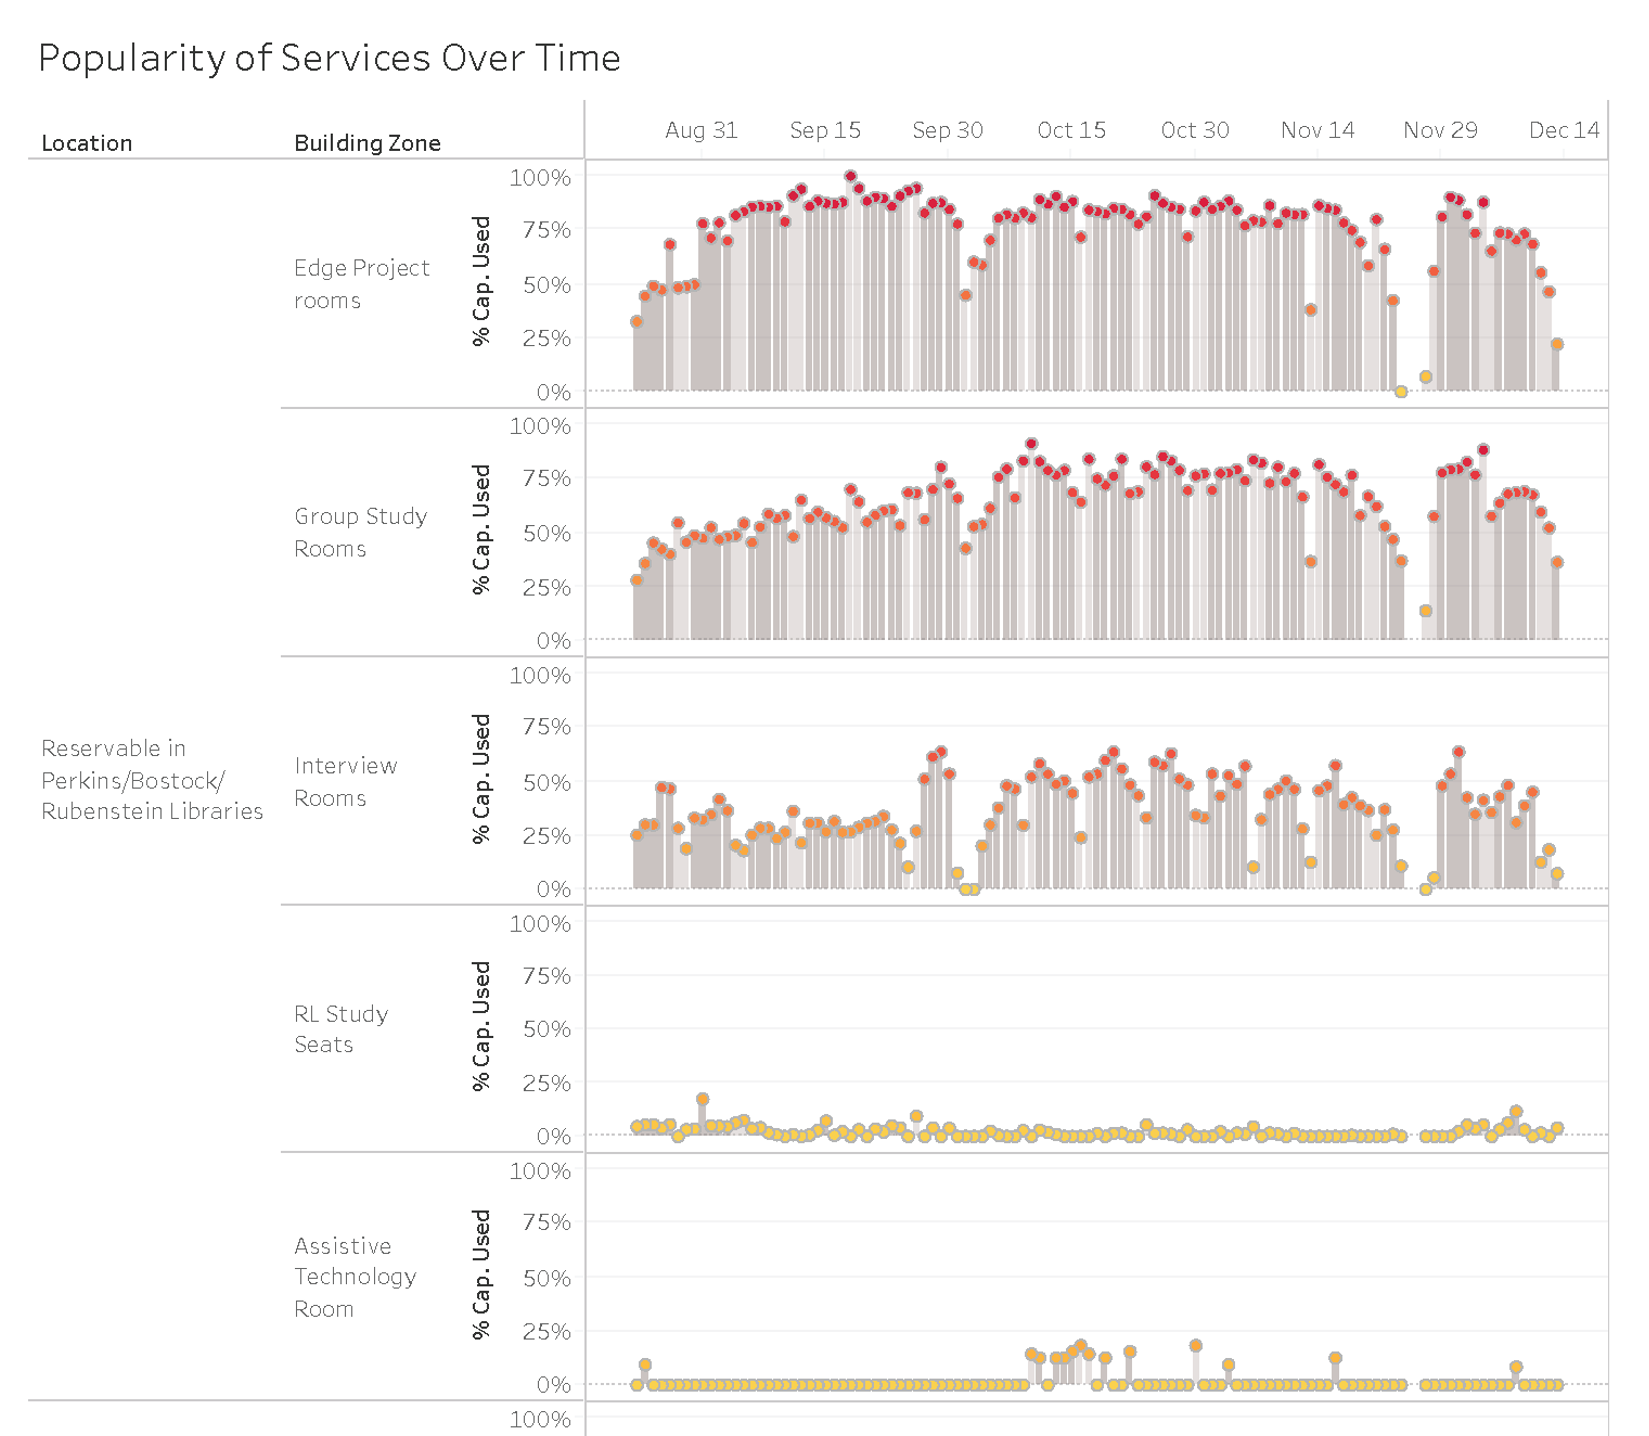
The fall of 2020 saw a host of new services added to our LibCal reservation system, including Library Takeout, library equipment, and library study spaces. To assist with decision-making around the number and type of reservations to make available, I took on a data processing and visualization project, resulting in a processing script and a series of dashboards.
Responsibilities:
- created and gathered datasets
- developed custom scripts to process data
- designed, refined, and published dashboards
Project Outputs:
Presentations at Conferences, Professional Gatherings
- Zoss, Angela M. (August 4, 2022). Wrangling Library Reservations Data. Presentation at NCSU Technology Jumpstart Program, virtual.
- Zoss, Angela M. (February 3, 2021). Wrangling Fall 2020 Reservation Data. Presentation at Duke University Libraries – First Wednesday Series, Durham, NC.